For reports that include comparisons to populations, please note that multiple data points are needed to ensure the reports are accurate. I.e. a trend report with 1 session worth of data won't be particularly useful.
To create reports, click the "Analyze" tab at the top of your screen and select the corresponding report:
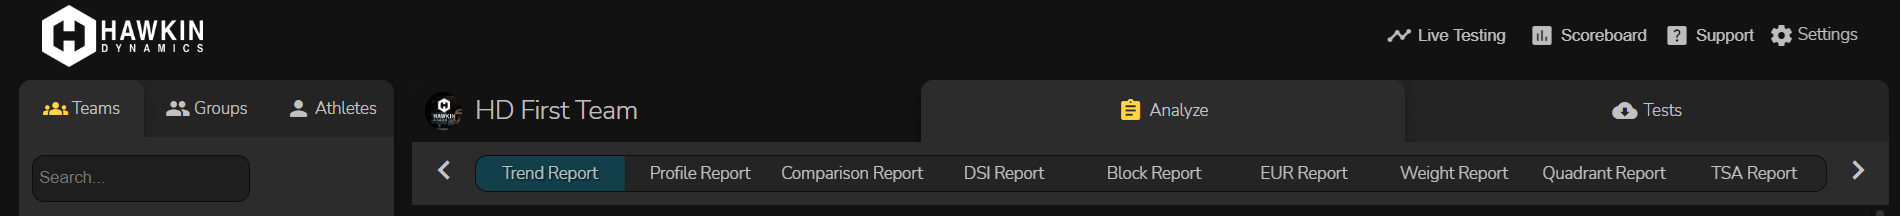
We have numerous reporting options at your disposal. As seen above, you have your "Trend Report" (Currently Selected and highlighted in blue). You also have the Profile Report, Comparison Report, DSI Report, Block Report, EUR Report, Weight Report, Quadrant Report, Ratio and the TSA Report (Total Score of Athleticism).
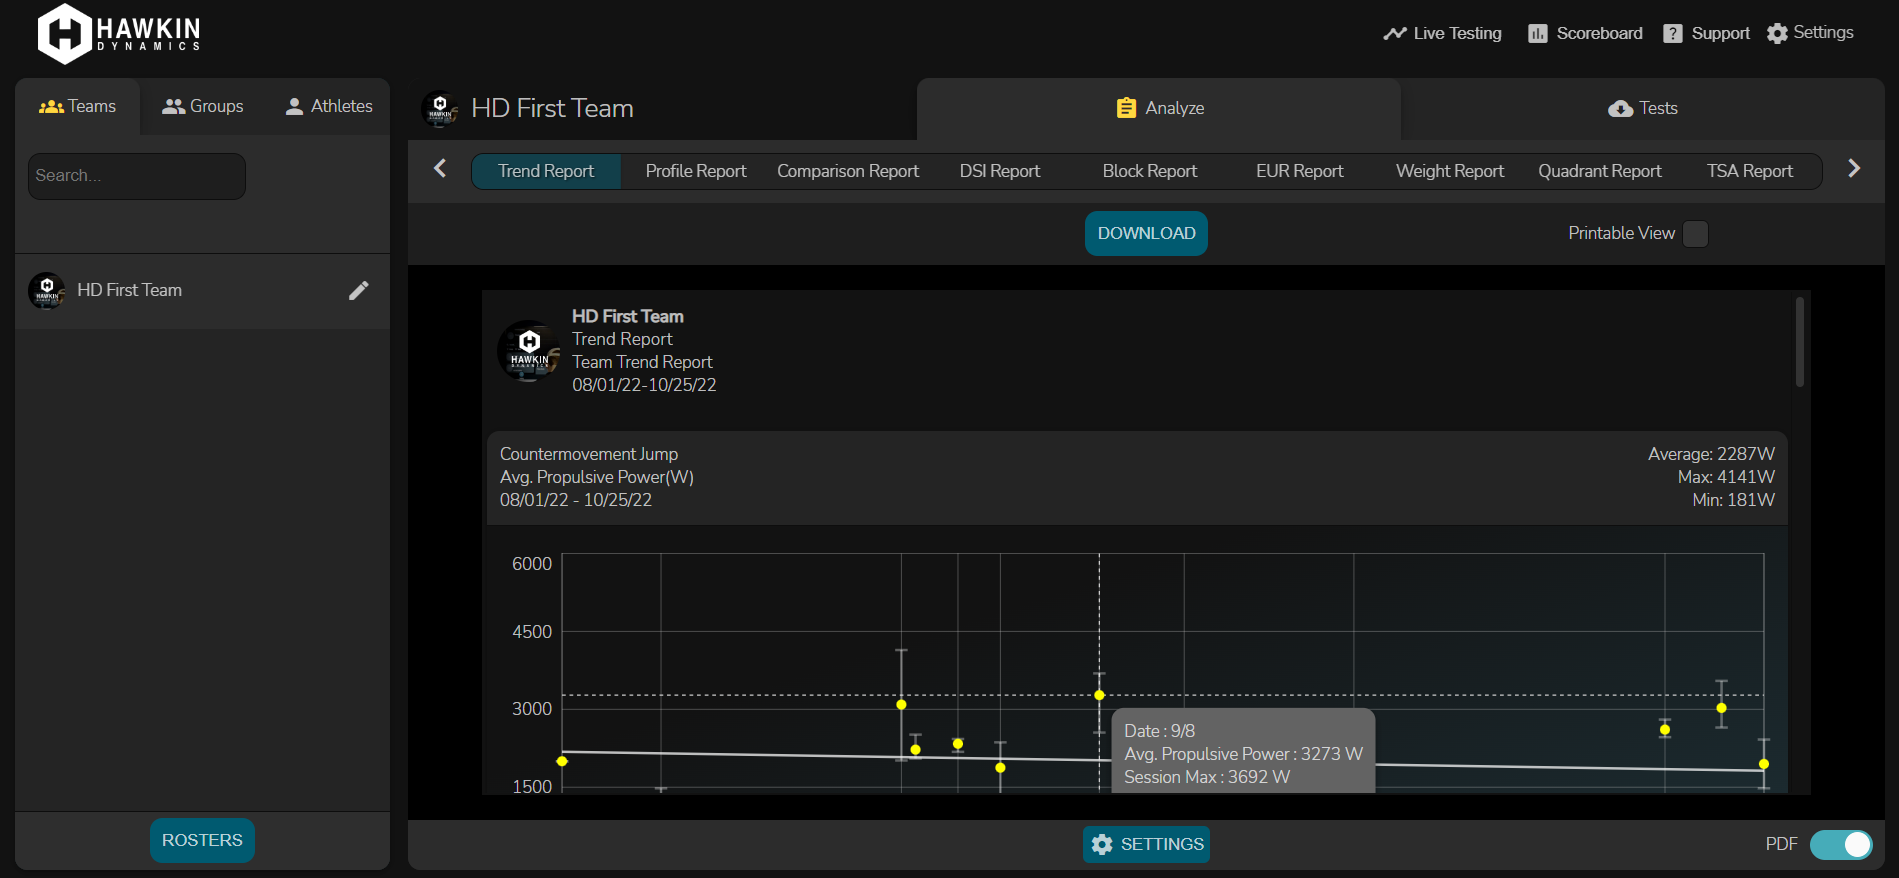
Trend Report
- Select "Trend report" from the analyze tab.
- Once selected, navigate to the "Settings" button at the bottom of the screen to customize the report to your liking
- You will have the option to run this for a group of athletes, an entire team, or a single athlete (this can be selected from the left-hand, side tab where it shows all 3 options).
- As mentioned above you can do this for the "Team" - look at how metrics are trending over time for a specific team within your organization. "Group" - see trends for group populations within your team. "Athlete" - see trends for an individual athlete on your team
- Select the test type and any appropriate tags
- Select one or two metrics
- Select the start and end dates if using the customized date range or select between 5,10,15 or 20 sessions.
- Your Trend Report will generate automatically - it will provide the average, maximum, and minimum for each metric over the selected period. Flip the switch in the bottom right-hand corner to format the report into a PDF, and add notes on the left. You can see a "Printable View" as well by checking the box on the top-right of the report. To download the PDF report, click the download button.
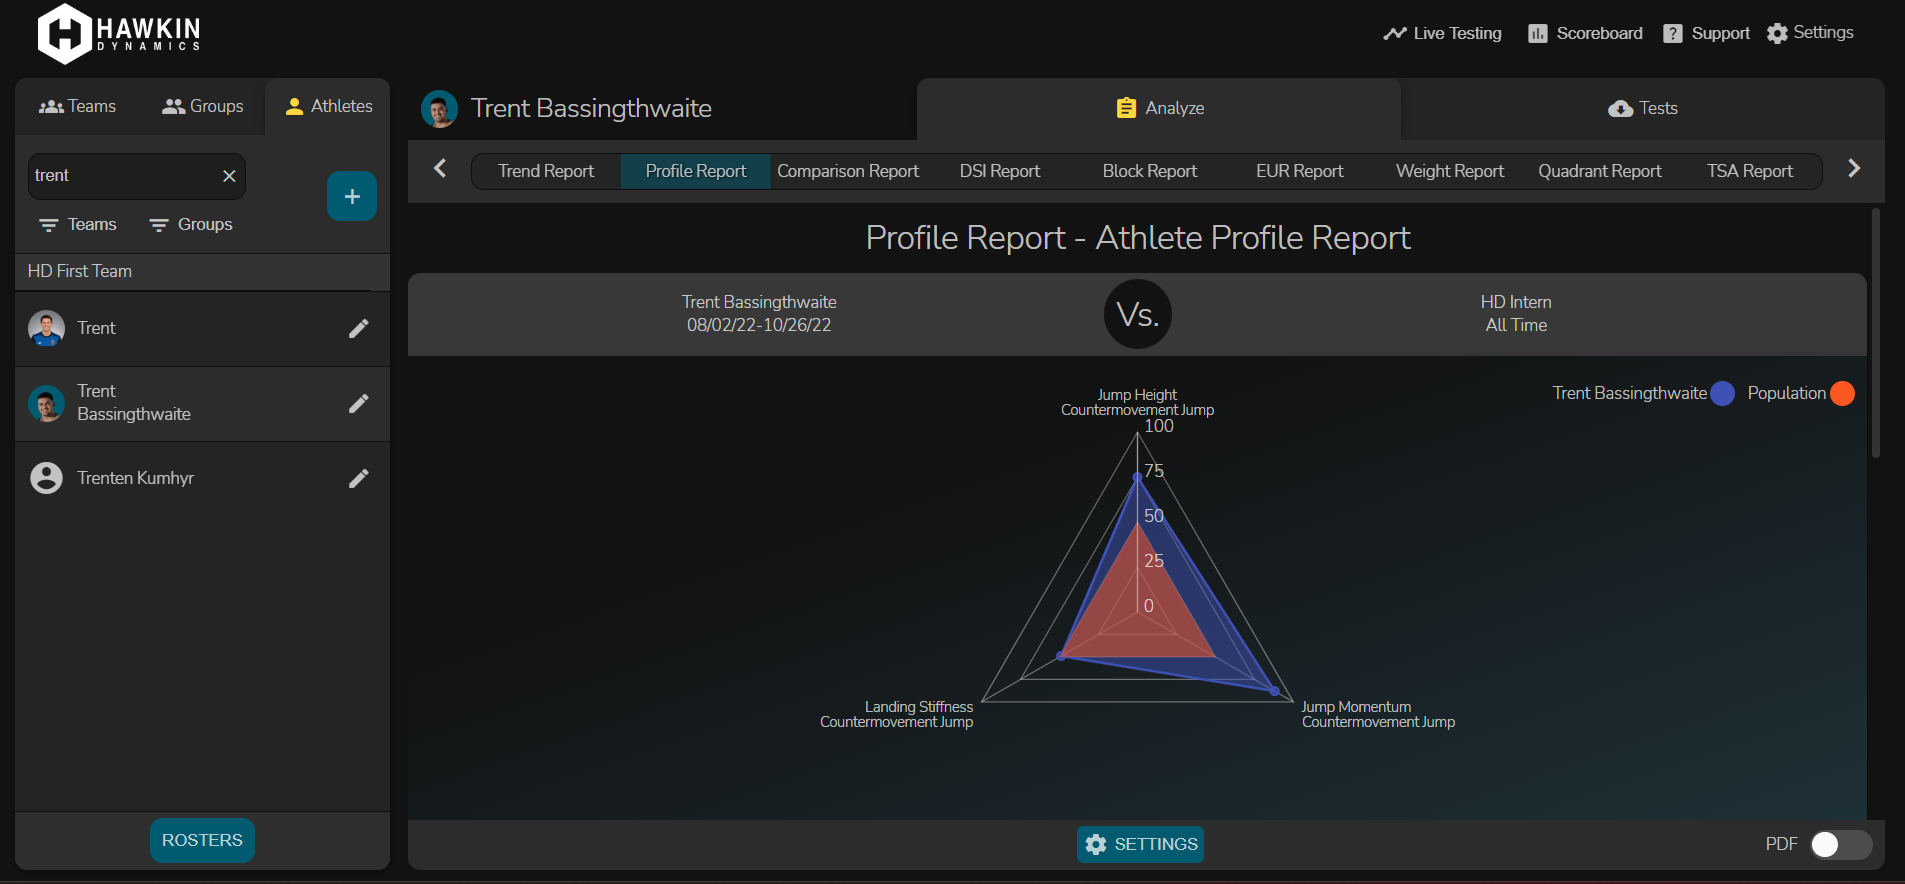
Profile Report
- Select "Athlete Profile"
- Navigate to the "Settings" button at the bottom of the screen.
- Name your 'Template' and proceed to adjust the settings and metrics you would like to your preference (minimum of 3, maximum of 6 metrics)
(Note, you can include metrics from different test types within the same report and have the option to select specific tags.) - If you're using metrics that are negative values, use the inverse scoring option to invert.
- Select the comparison population (This is a good way to compare an incoming athlete/ recruit your current position group, an elite single athlete, or an entire team)
- Choose the graph type you'd like to use - 'Radar' or 'Bar'
Comparison Report
- To create a comparison report, select it from the top reports menu under the analyze tab.
- Select the 'Settings" button at the bottom of the screen.
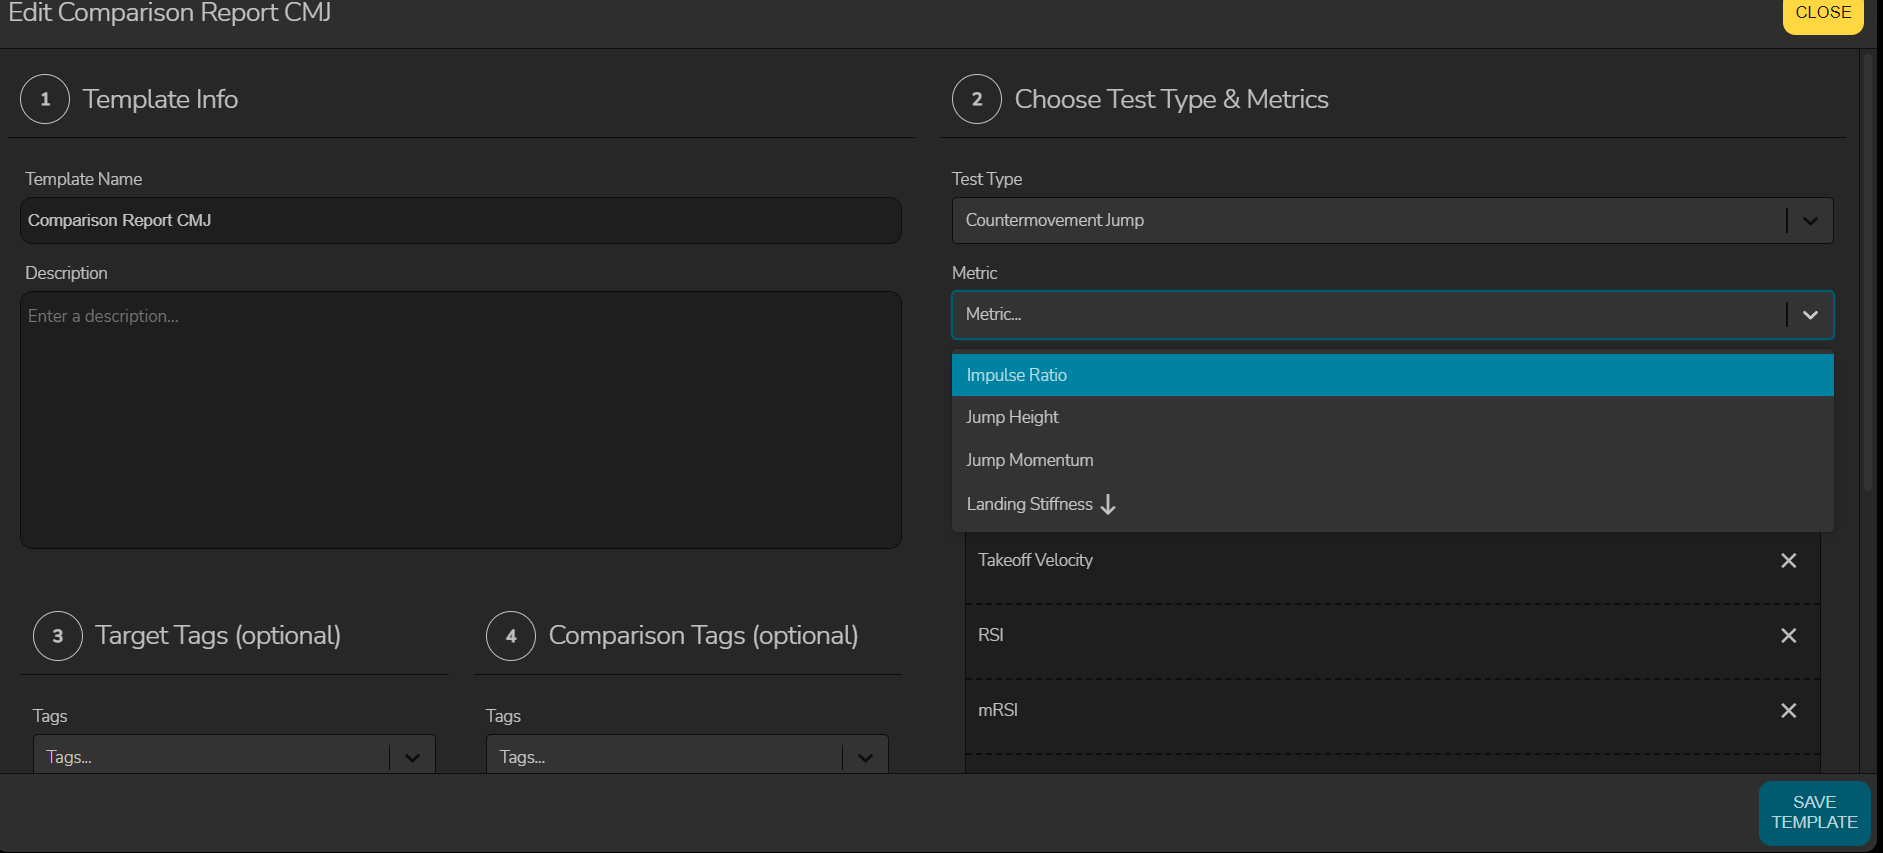
- Choose the test type (CMJ, Squat Jump, etc.) and up to 6 metrics for comparison.
- Select the type of data set you'd like to compare (athlete, group, team) for Data set A, choose any tags, and pick a date range or previous sessions to compare against
- Repeat step 4 for Dataset B
- One thing to note is you can also set target tags.
For example, you can set the target tag as single leg left and the comparison tag as single leg right, and then get the comparison of left versus right for single leg attempts.
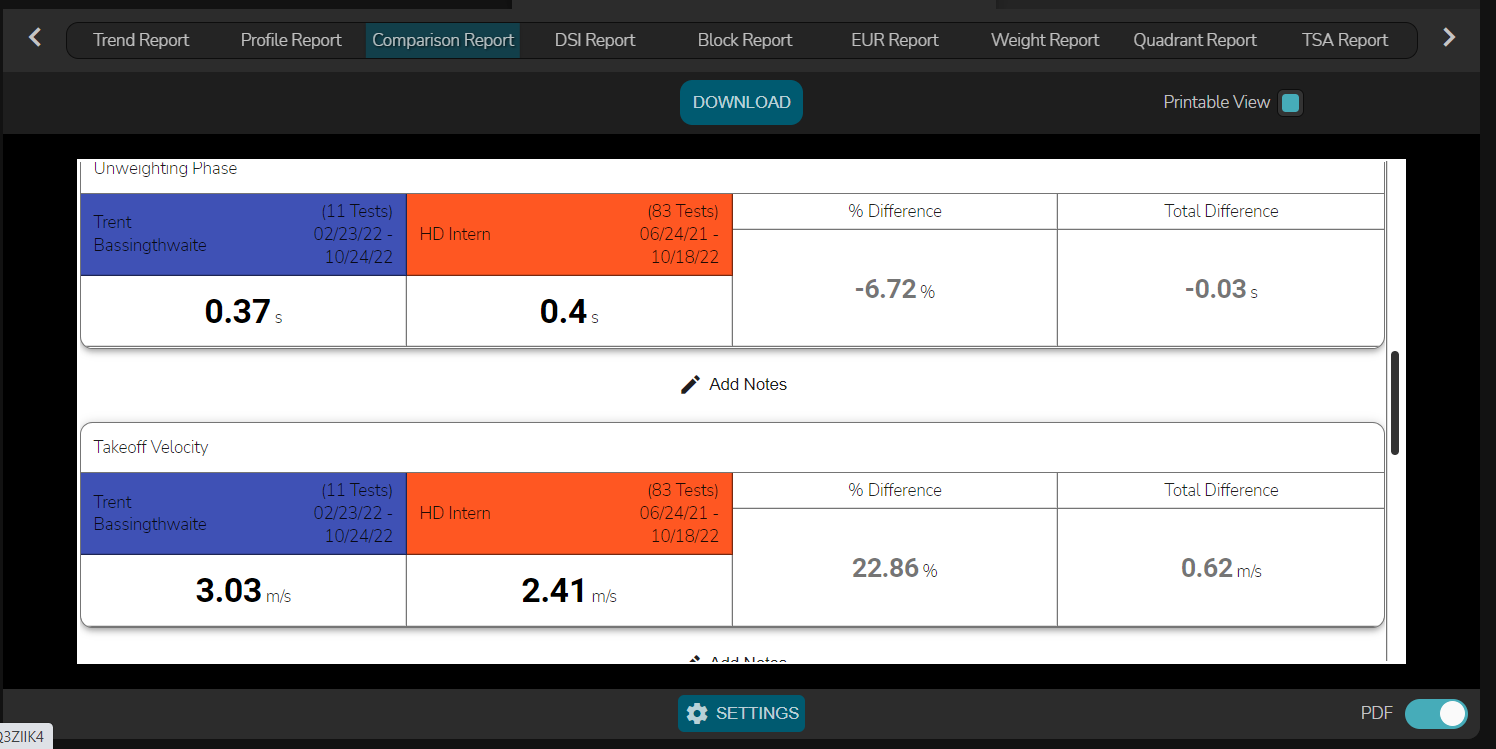
Your report will generate in table format with values for each metric for both datasets, % change, and total change.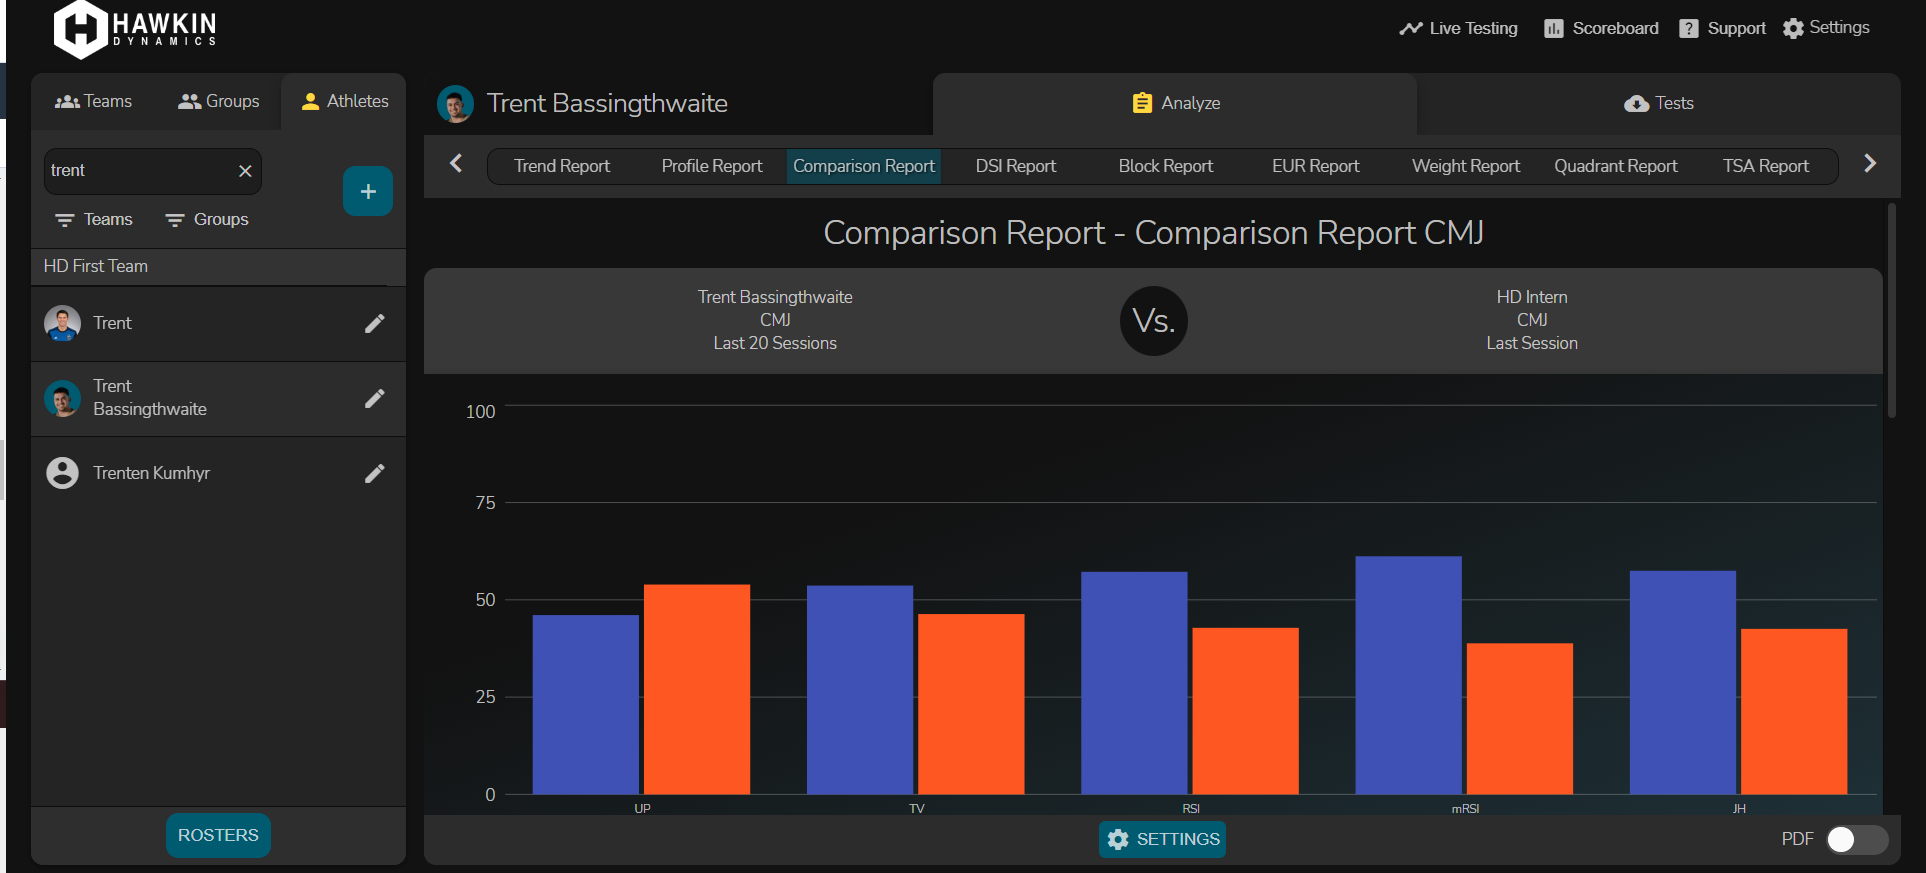 6. Click the PDF switch to format the document as a PDF, add notes, and download PDF.
The Block Report
The Block Report resembles a table in excel and is used to answer a basic question...Did the individual improve?

- From the Analyze Tab, you will select the "Block Report"
- You will then select if you want to run this report for an Athlete, Team, or Group from the left menu bar.
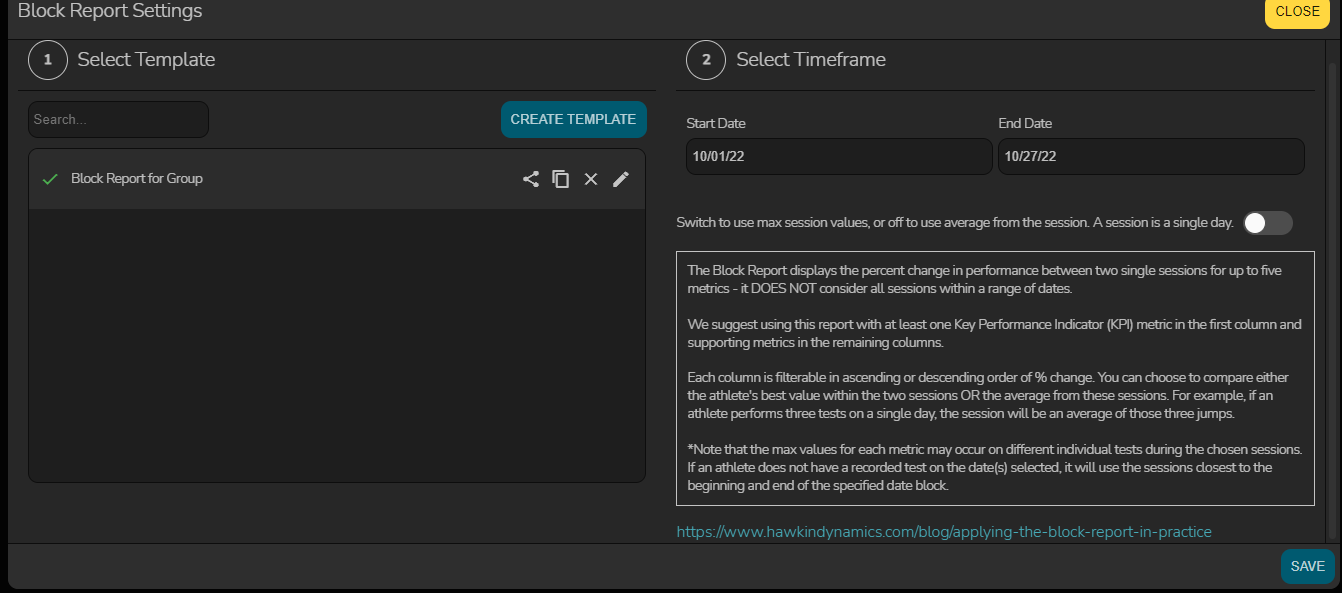
- Navigate to the 'Settings' button at the bottom of the report screen
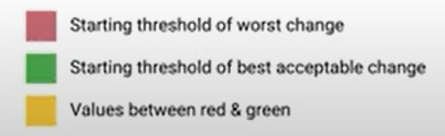
- First create a template then select the Test-Type you would like to assess in the report along with the metrics in which you will use to generate the report and set the flagging parameters under the Template Settings (Red, Yellow Green)
- Select the date range you would like the report to consist of:

- These are custom parameters and will flag red, yellow, or green based on the percentage change between the two dates.
NOTE: In some instances, a Lower Value is preferable for certain metrics. A lower 'Time To Takeoff' is typically better than a higher 'TTO' meaning the athlete is quicker off their feet and jumps faster.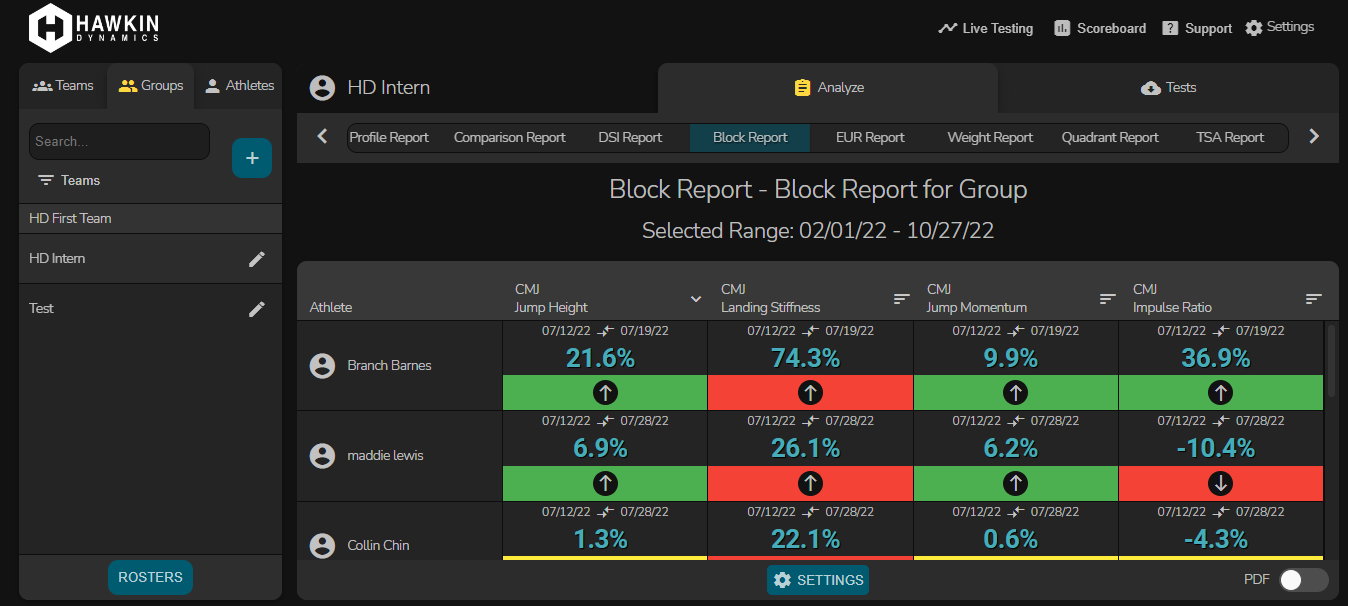
DSI Report (Dynamic Strength Index)
- The DSI report is a simple ratio of CMJ and a maximal Isometric Test (Typically the Isometric Mid-Thigh Pull or Isometric Belt Squat). DSI is useful for assessing an athlete’s needs – strength or speed.
EUR Report (Eccentric Utilization Ratio)
- The EUR is simply a ratio of CMJ and Squat Jump. EUR is useful for assessing an athlete's stretch-shortening cycle function overtime.
Quadrant Report
- This report allows to see where each athlete is stacked up in comparison to each other. By taking two metrics and setting them on the X and Y axis, athletes are put in the quadrant that represents their metrics. Quadrant I represents the top performers while Quadrant III represents the bottom performers.
- Learn more about the Quadrant Report here.
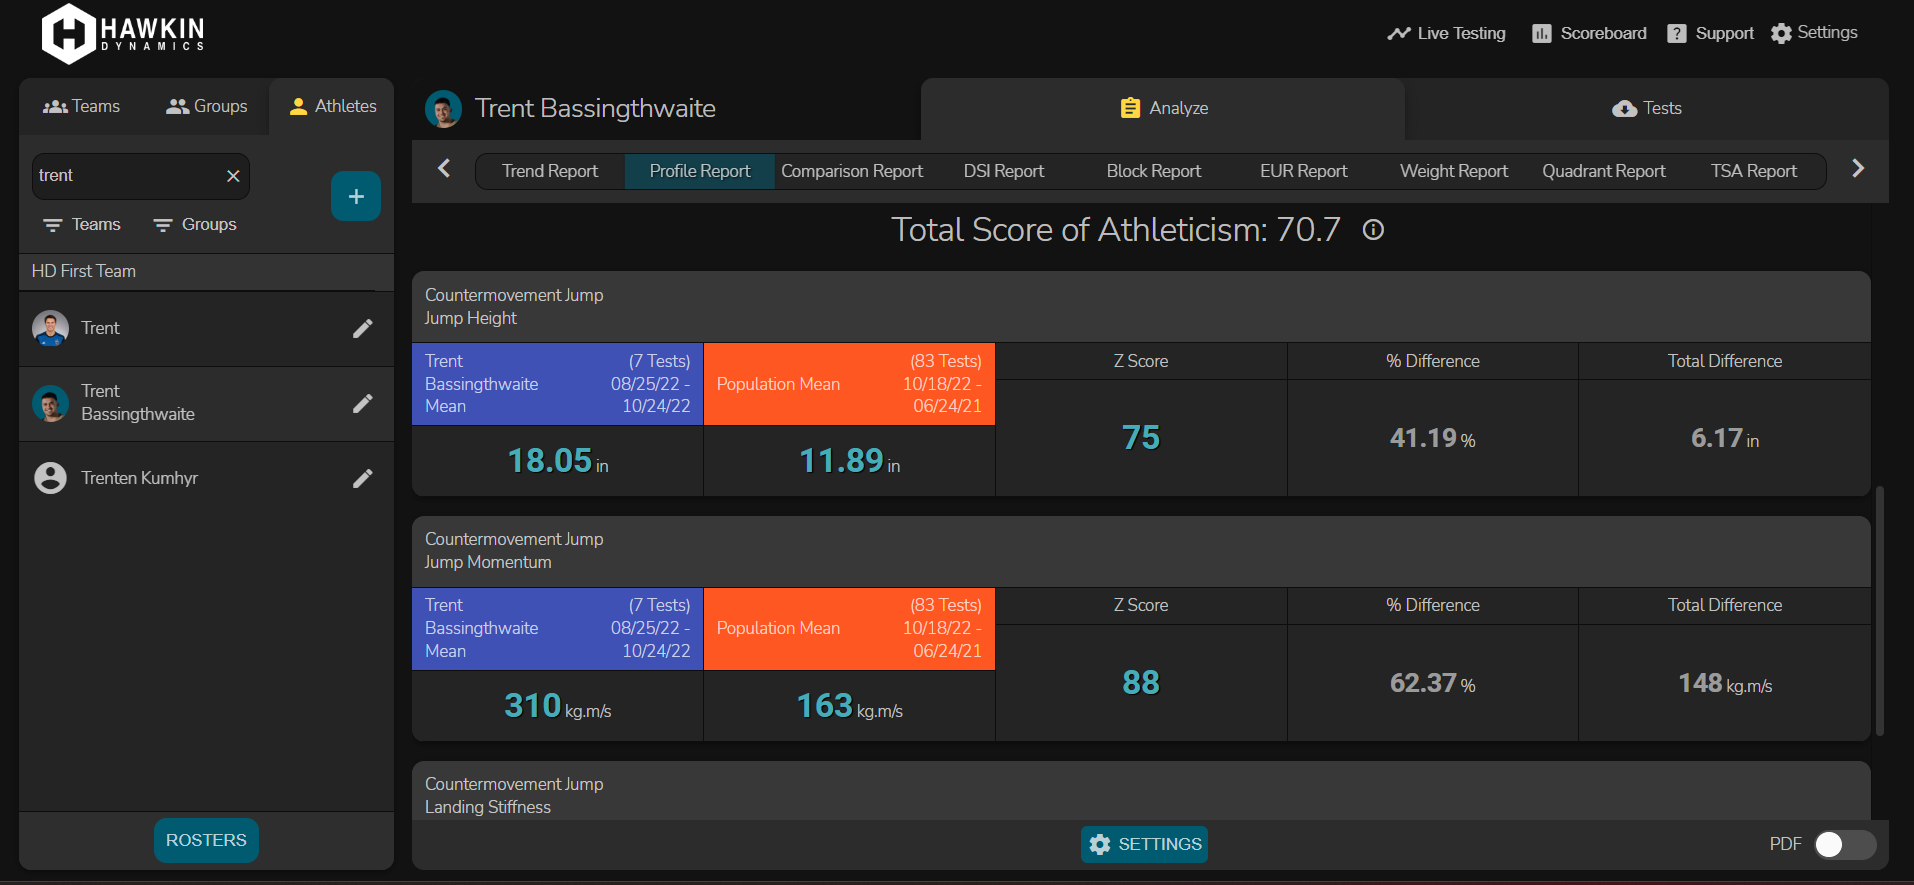
TSA Report (Total Athleticism Report)
- In summary, this report allows you to score similar athletes against one another in one report (1-100). a total score of 100 would mean that the athlete is the very best in ever test/metric for the given time period. A score of 50 is average.
- Read a full article on the TSA report here.
Weight Report
- Every time an athlete is on the force plates, system weight is accurately calculated and reported in real time. This new report shows the athlete’s body weight trend over a set date range.
Ratio Report
- The ratio report allows you to select two metrics of the same unit and create a custom ratio to track changes overtime.
- To create a ratio report the metrics you are comparing must have the same units. The DSI and EUR reports are examples of a ratio report.
- Other Example Ratio Reports
- Peak Propulsive Force (Newtons) : Peak Braking Force (Newtons)
- CMJ Relative Braking Force (%) : ISO Relative Peak Force (%)
- Propulsive Phase (Seconds) : Braking Phase (Seconds)
- Average Relative Propulsive Force (%) : Average Relative Braking Force (%)
- Other Example Ratio Reports