Analyzing Data in the Cloud
The Hawkin Dynamics software makes it extremely simple to analyze your data without the need for exporting. However, we understand that some users like the ability to export their raw data and either process it themselves in Sheets, or upload it into a third party athlete management system (AMS).
Within the cloud there are multiple options to export:
- Exporting From the Tests Tab (Team, Group, or Single Athlete)
- Calculated Tests
- Averages of Tests
- Averages & Tests
- Exporting a Session
- Calculated Tests
- Averages of Tests
- Averages & Tests
- Exporting a Single Test
- Raw force-time data
- Raw velocity-time data
- Power and time data
You can export these at the Team level, Group level, or Individual Athlete level. A Team is a larger group of athlete, and a Group is a cluster of athletes within a team. Athletes can be a part of multiple groups, and they are most often position or demographic based. These options are explained in detail below.
Raw vs. Calculated Data:
Calculated data is the data in metric form (i.e. Jump Height, Braking RFD), whereas Raw Data is the data at each timestamp. Raw data can be exported by force-time, velocity-time, and power-time.
Option 1: Exporting From the Tests Tab
-png.png)
- First select the "Tests" tab
- Second, select your population in the left hand corner, under the logo. The list of most recent tests will change based on the population you have active (i.e. Team, Group, Athlete).
- The active population will display all of the most recent data for that population. The most recent tests will show up at the top, in the middle of the screen.
- If you are trying to export only a single athlete's data here, make sure that the athlete population tab is selected under the logo, and the desired athlete is clicked.
- Once you are in the Tests tab and your desired population is selected, you can export data by choosing a custom "Date Range" near the middle left of the screen. If you do not select a custom data range, it will export the most recent 100 tests. If you scroll to the very bottom, it will spin up 100 more tests, so on and so forth. We suggest using the custom range option.
- Once you have clicked the export button in the middle bottom of the screen, it will bring you to the image below
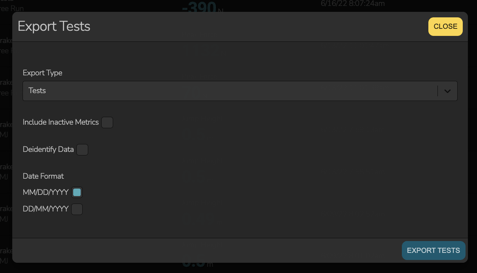
- Click the "Export Type" dropdown. You will have options here on the exports you download.
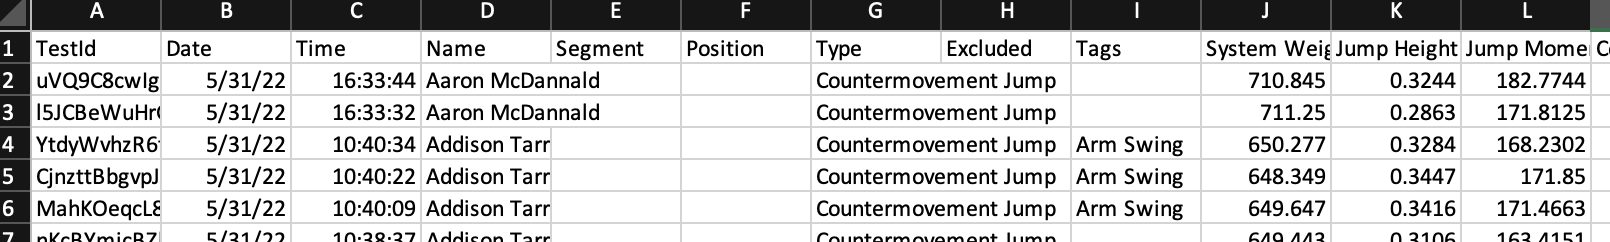
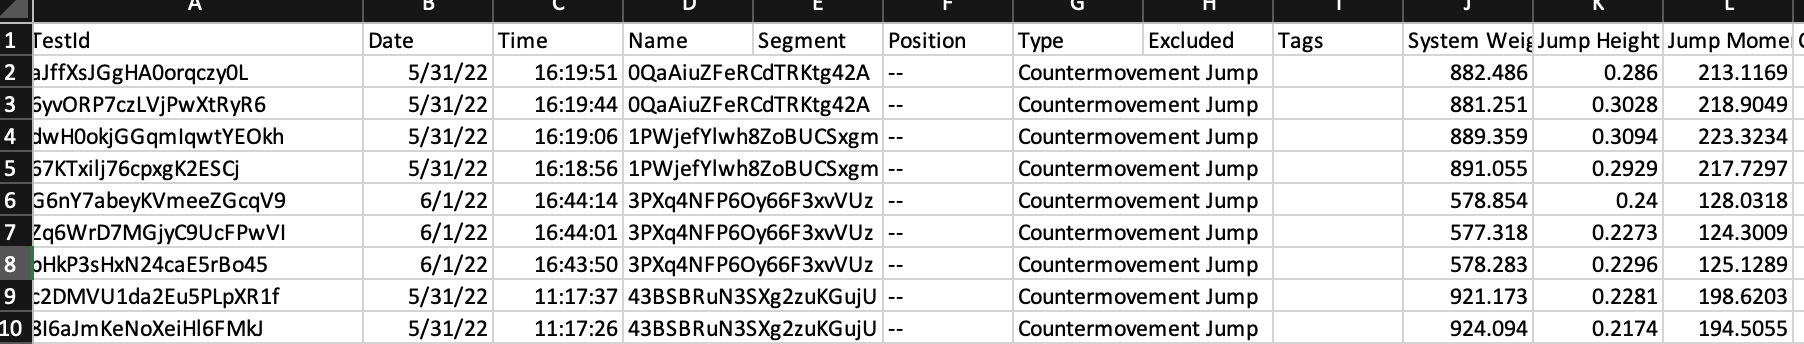
- Tests - this option will export each individual's test within the team or group, each individual will receive a row for a single tests with each metric in columns. For example, if an individual jump tested 3x on a single day, there will be three rows for that individual and date.
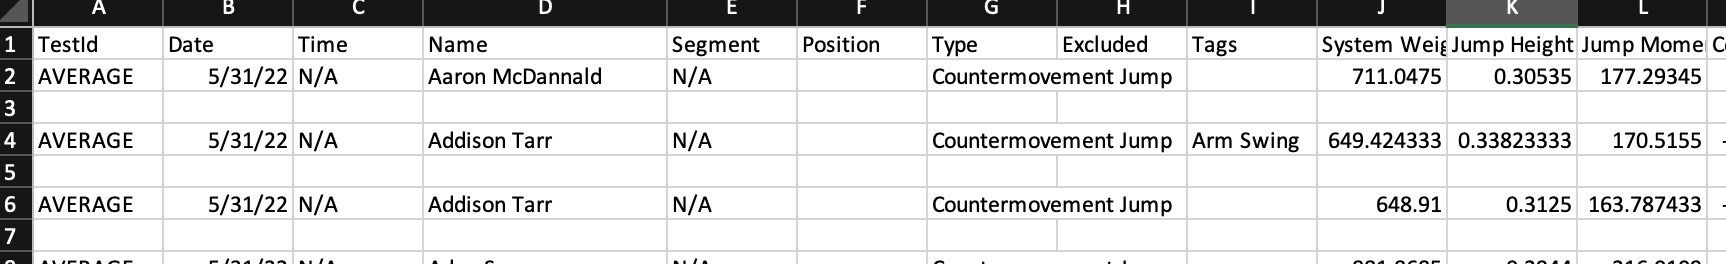
- Averages - each individual will receive a row for each date. The combination of an individual's name and date will be the average for the session. A session is a day. For example, if an individual jump tested 3x on a single day, there will be one row for that individual with an average of each metric.
-
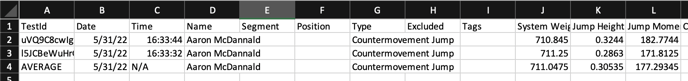
- Average and Tests - this option is a combination of the previous two options. If an individual jump tests 3x on a single day, there will be four rows for that individual and date. The top three rows will be each individual tests. The fourth row will be the average for those three tests.
- Choosing to "Include Inactive Metrics" will include every metric that we report. If you do not choose this option, only your active metrics will be exported.
- By selecting the "Deidentify Data" checkbox, you will remove the individual's names from the export. Each individual will receive a unique 20 digit code. The Team or Group name will also be Deidentified.
- The last thing to select before clicking "Export Tests" button will be the "Date Format". This is a user preference on how you would like the date listed in Sheets.
Tests in Sheets View
Averages and Tests in Sheets View
Averages in Sheets View
Deidentified Data in Sheets View
Option 2: Exporting a Session
-png.png)
- First identify the sessions box on the right hand side of the screen, in the Tests tab view
- Click the session that you are interested in viewing (i.e. July 1, 2022)
- Once you click a session, it will bring you to each test that was completed within that session. Remember, a session is a single day. So every test type that was used in this day, along with the active population will display.
- This view will look a lot like the post test view on the mobile app. You can quickly change between athletes on the left side bar.
- In order to export every test from this single session, click the "Export Tests" button the the bottom of the left hand side bar. You will have the same options as Option 1 above for exporting, Tests, Tests and Averages, or Averages.
Session View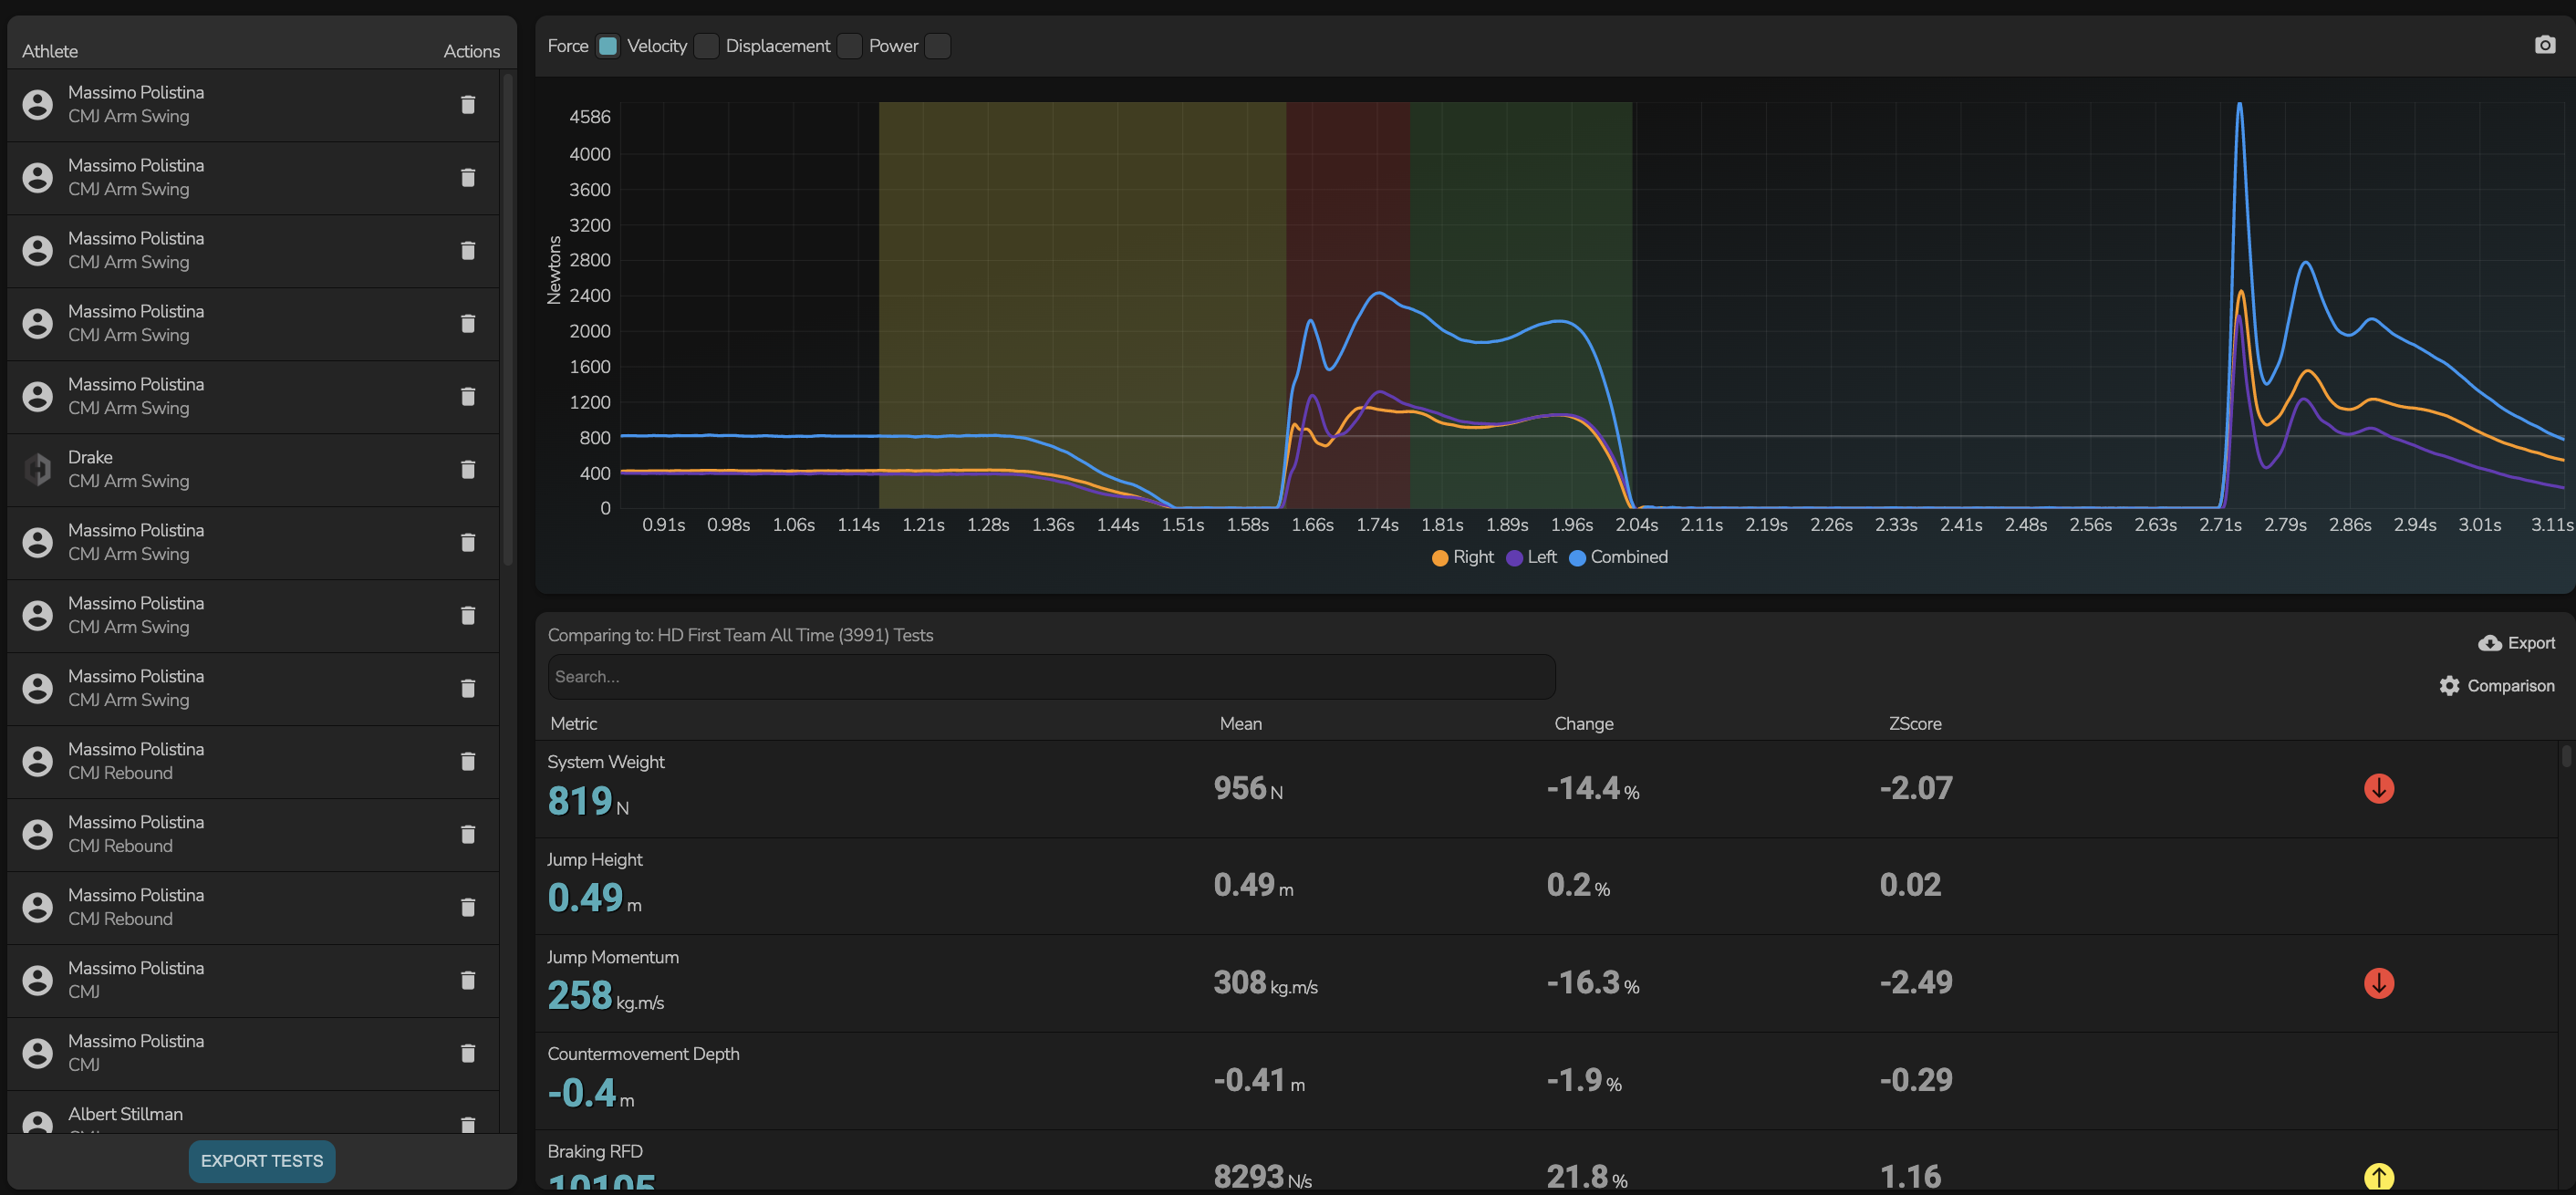
Option 3: Exporting a Single Test
-png.png)
- In order to export a single test, you will need to first select the single test.
- Identify the athlete first by clicking the athlete population tab and searching the athlete's name.
- Once the athlete is active, click the test in the middle of the screen if it was a recent test.
- If the test was a historical test, use the session sidebar to identify the session (i.e. date) that the athlete tested.
- Click on the session date to enter the session view. Once inside, click the single tests.
Exporting single test from the middle scroll-png.png)
Exporting single test from the session view - right side export button-png.png)
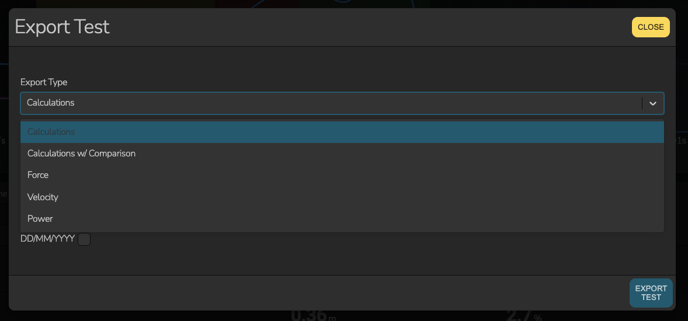
- Under the single test export light box, you will have multiple options.
- Calculations - this option is the same as above, however now there will only be a single row with the selected date and test.
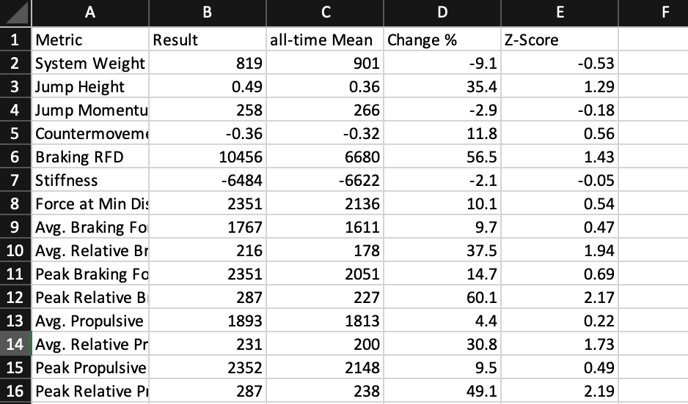
- Calculations w/ Comparison - this option will give each metric for the single test in column one, the following columns will be the comparisons that are active in the cloud. Comparison average, percent change, and Z-scores will export here.
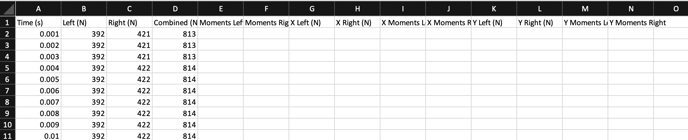
- Force - this is the raw force-time data. For the HD force plates, there will be four columns. The first is time and the next two are left and right force at each time stamp. The HD force plates sample 1000 times per second. So there will be 1000 rows every second. The fourth column is the combined left and right force.
- Velocity - this is the raw velocity-time data. Same export as the raw force-time data, however now velocity is in the column in stead of force.
- Power - this is the raw power-time data. Same export as the raw force-time data, however now power is in the column in stead of force. Power is calculated by multiplying the combined force by the velocity in the same row, at the corresponding timestamp.
Calculations with Comparisons export in Sheets
Need additional help?
Email: techsupport@hawkindynamics.com